News Brief
BEES 1.0: Building for Environmental and Economic Sustainability
BEES 1.0
Software for Windows™ by Barbara Lippiatt of the National Institute of Standards and Technology, Building and Fire Research Laboratory, Build-ing Environment Division. Available for $49.95 plus $6 S&H from: U.S. Green Building Council, 90 New Montgomery Street, Suite 1001, San Francisco, CA 94105; 415/543-3001, www.usgbc.org. Also avail-able (for the time being) at no charge by calling the U.S. EPA Pollution Prevention Hotline: 202/260-1023.
The government data is now in, and it turns out that cellulose insulation has twice the environmental burdens of fiberglass, that vinyl composition tile is preferable to linoleum, and that standard asphalt shingles beat out clay roofing tiles and fiber-cement shingles on the environmental scale. What’s going on here? Is the conventional wisdom of the green building community totally off-base? Has political corruption now engulfed the environmental bean-counting process? Before we try to answer these questions, some background:
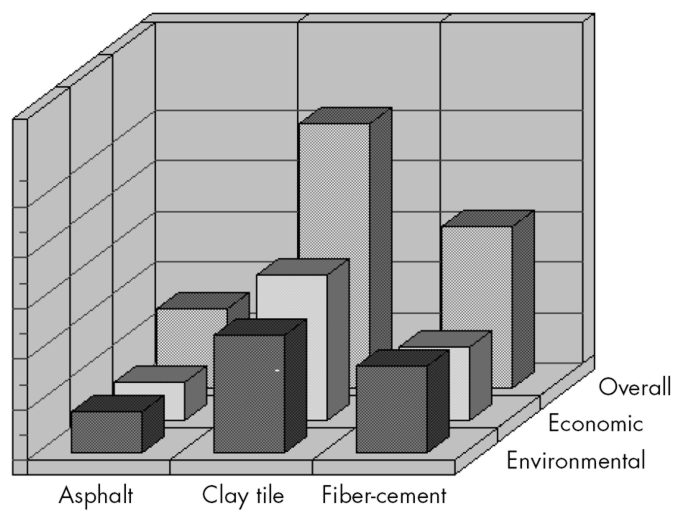
Sample BEES output showing environmental, economic, and total performance for roofing materials (longer bars are worse!)
To do this the program presents data from environmental life-cycle analyses of building materials in conjunction with an economic analysis based on life-cycle costing. The economic component is relatively straightforward: all costs for initial purchase, maintenance, and replacement (if necessary) of a product are combined for a 50-year period, based on construction-industry-standard cost and durability data. Future costs (after the initial installation) are discounted at a rate that the user of the software can adjust—the default is 3.6%, which was the 1997 standard for most government projects.
Along with the financial discount rate, BEES allows the user to set other important parameters, such as how each of the six environmental impact categories should be weighted relative to each other, and how the environmental score and economic score should each be weighted when determining the total score for a material. Once one has chosen which materials to compare, it’s very easy to adjust any of these parameters and recompute the results. This feature is great for testing how sensitive the results are to each of these settings.
BEES includes comparisons among the following building materials:
•Concrete with 0%, 15%, and 20% flyash, compared for use in slabs-on-grade, basement walls, beams, columns, and driveways/sidewalks;
•Oriented-strand board and plywood, compared as roof sheathing and wall sheathing;
•Bricks-and-mortar and stucco, compared as exterior cladding materials;
•Cellulose, fiberglass, and mineral wool, compared as wall and ceiling insulation;
•Ceramic tile with recycled glass, linoleum, and vinyl composition tile, compared as floorcoverings; and
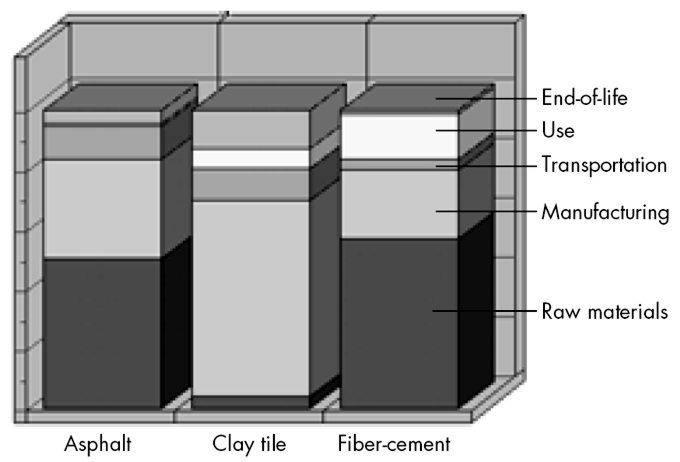
Sample output showing breakdown by life-cycle stage of environmental impacts (longer bars represent more impacts)
The user selects two or more options for one of the applications and is prompted to select a transportation distance from the manufacturing location to the building site for each one. BEES then computes results and displays three-dimensional bar charts comparing the economic performance, environmental performance, and totals for the selected products. It is important to note that the scores represented in the charts are not absolute but are relative to the other products being compared. Thus, the score for asphalt roofing is not the same when it is compared to fiber-cement roofing as when it is compared to clay tile.
The charts can be manipulated to provide different views of the data, and additional charts that provide greater detail on the environmental burdens can easily be generated. For example, one can view a breakdown of the environmental score by life-cycle stage or by environmental impact category (the default format). Most categories can be further dissected into their contributing factors. For example, a Global Warming chart shows relative contributions of CO
2, methane, and NO
X to that score; and a Nutrification chart shows what part phosphates, NO
X, ammonia, nitrogenous matter, nitrates, phosphorous, and chemical oxygen demand contribute to the total.
A user who really wants to get into the nitty-gritty can browse the actual data tables from which all these charts are generated. Each table consists of 97 rows of emission and resource consumption data for each material. Given the level of complexity and amount of data involved, BEES does an excellent job of making the data accessible.
The 84-page technical manual that accompanies the program does a nice job of explaining how to use it, as well as providing detailed explanations of how the data is compiled and how some inherent conflicts are handled. It also provides a brief description of each material and how it is handled in the software.
For all its elegance, the results BEES provides are only as good as the data and assumptions that the program contains. This is where the program’s weaknesses become apparent, in three general areas:
1. The scope of the data. While impressive in quantity, BEES still does not include any information on some potentially significant issues. These include ecosystem impacts of mining and forestry operations, and difficult-to-quantify information about emissions that might be highly toxic to humans and the environment, such as endocrine disruptors from chlorine-based processes. Also, the information on indoor air quality impacts counts only estimated total VOC emissions, with no consideration of the relative hazard posed by various compounds.
2. Questionable assumptions about some products. While some of the products and their uses are described with great accuracy, the assumptions for some others are based on questionable information, such as:
•The stucco cladding is assumed to be a pure cement-based product, rather than the far more common polymer-based or polymer-modified stucco products.
•The ceramic tile is assumed to be set in thin-set (latex-modified) mortar that is
1⁄
2” (13 mm) thick, about four-times the thickness of a typical thin-set installation.
•The OSB is assumed to contain only MDI binder (based on the assumption that most OSB is made with MDI)—when a large portion of OSB is still made with phenol formaldehyde (PF) resin, and recent data suggests that even OSB made with MDI contains about 50% (PF). Also, the wood species listed for OSB are completely inaccurate. This error may not be relevant, however, as forest ecosystem impacts are not considered in the assessment.
•Logs used to make plywood are assumed to have an average diameter of 7” (18 cm), which is more likely representative of a lower limit on their size.
3. Lack of indication about the reliability of the numbers. Hard numbers are difficult if not impossible to come by for most of these processes, so the data are inevitably derived by various approximations. Yet the program provides scores to the second decimal point, without any guidance as to which, if any, numbers might justify that level of accuracy. To be fair, this need to report on the level of uncertainty is listed among the “proposed model enhancements” for a future version of BEES.
BEES is seductive in the way it promises hard numbers in response to tricky questions. And it is dangerous, because it’s all too easy to overlook the fact that the information behind the assessments does not justify the reliability that the numbers suggest—all the more since BEES comes from an agency traditionally associated with maintaining quantitative standards. While the American Institute of Architects’
Environmental Resource Guide has been criticized for providing lots of explanation and too little hard data, BEES goes to the opposite extreme.
For BEES to become useful to those interested in the environmental impact of building materials, detailed explanations of data sources and assumptions must be available directly alongside the charts. Only in this way can users assess whether the numbers apply to their specific situations and adjust them for products that don’t match the national averages. The manual provided with BEES 1.0 only provides the barest beginnings of such documentation.
In response to the questions raised above, we can only guess at some of the reasons for these counter-intuitive outcomes. A closer look at the data in BEES reveals that the very high burdens associated with cellulose insulation occur almost entirely at the raw materials stage and are primarily in the form of air pollutants. We are also aware that some European models attribute very high environmental costs to the collection of waste paper for recycling (i.e., energy use for curbside collection), so it appears that these impacts are responsible for cellulose looking so bad.
The fact is that recycling advocates often do overlook some of the negative impacts of the process, and it is possible that from an overall life-cycle perspective, cellulose isn’t quite as rosy a product as many analysts (including
EBN) suggest. Given the known inaccuracies in other aspects of the program, however, it seems likely that this data is way off the mark. Without a more detailed account of how it is derived, it just isn’t possible to tell.
In terms of linoleum and vinyl (PVC) tile, BEES assigns an 18-year useful life to both products but ascribes twice the maintenance requirements to linoleum as to vinyl (acrylic lacquer and wax four times per year, as opposed to twice). As the two products are fairly close in the comparison, this assumption alone might be enough to tip the balance in favor of vinyl. In addition, a primary reason for widespread environmental concern about vinyl has to do with possible endocrine disruptors associated with PVC manufacture or disposal, an issue not considered at all in this model.
If you’re interested in the details of environmentally aware material choices, by all means get this software. The manual itself is worth reading for its detailed explanations of life-cycle analysis and life-cycle costing considerations, and the program is easy to use and fun to play with. But given the gaps in the data and lack of documentation as to its sources, we certainly wouldn’t suggest that anyone try to make material selection choices based on this model. A little knowledge is a dangerous thing.
Published May 1, 1998 Permalink Citation
(1998, May 1). BEES 1.0: Building for Environmental and Economic Sustainability. Retrieved from https://www.buildinggreen.com/newsbrief/bees-10-building-environmental-and-economic-sustainability
Add new comment
To post a comment, you need to register for a BuildingGreen Basic membership (free) or login to your existing profile.